Using the pysi-viewer GUI
Pysi contains a simple GUI created using bokeh.
To run this, first install pysi, for example in a virtual environment.
You can then run the GUI by typing
pysi-viewier root
where root is the model you have run. This will display a GUI like the following at http://localhost:8888/
[1]:
from IPython.display import Image
Image(filename='bokeh.png')
[1]:
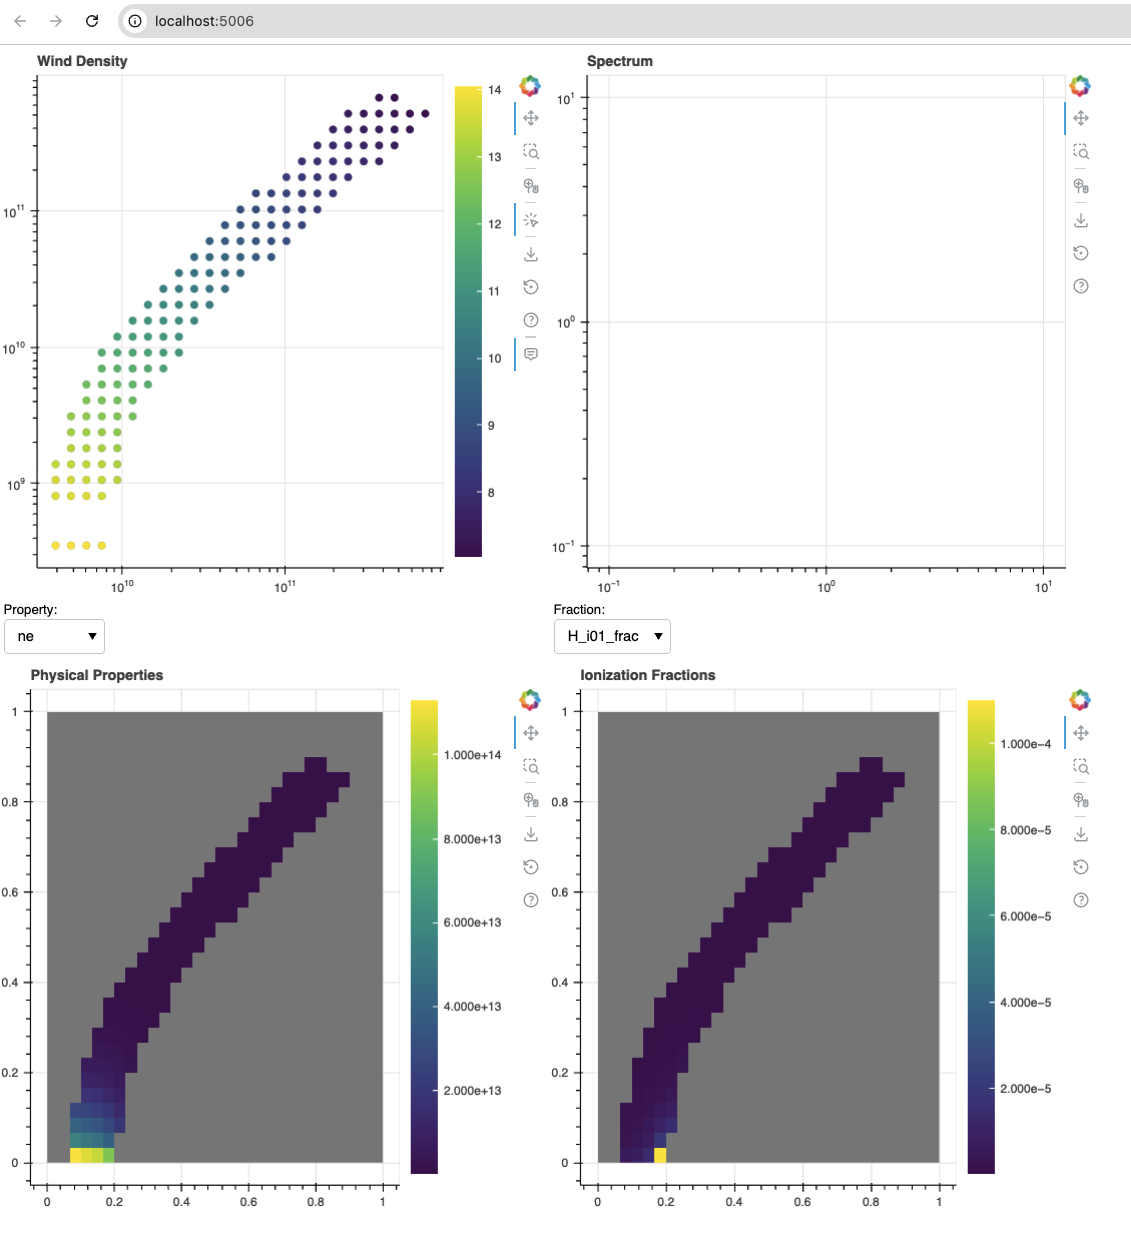
The top left plot has a clickable version of the wind which then displays the in-cell spectrum on the top right. The bottom two panels show the physical properties and ion fractions in the wind.
Note: This is a beta version and requires testing and improvement – for example, it has only been tested on models that use the `matrix_pow’ ionization mode, and are 2D.